The quality of Ohio’s rivers and streams has improved tremendously from the grossly polluted conditions that were commonplace in the 1940s, 50s, and 60s. Raw and poorly treated discharges of sewage from municipal sewer systems and gross industrial pollution including the discharge of toxic compounds was the norm. The Federal Water Pollution Control Act amendments passed by Congress in 1972 was the first legislation of its kind to mandate reductions in pollution from “point sources” such as municipal sewage treatment plants and industries. Also known as the “Clean Water Act” (CWA) this bipartisan federal legislation was administered by the newly created U.S. Environmental Protection Agency (U.S. EPA) who delegated day-to-day operations such as permitting and water quality standards to states that met their requirements. States quickly followed by updating their own pollution control laws to restore polluted water resources in the years that followed - increased environmental protection swept the nation.
River and Stream Size Matters
One of the baseline CWA requirements for states was to report the status of their water resources on a biennial basis. Known as the “305b Report” (for Section 305[b] of the CWA) these assessments of statewide water quality grew in scope and sophistication through the 1970s and 1980s. In the 1990s, 305[b] was merged with another CWA requirement known as the “303d List of Impaired Waters” (for Section 303[d] of the CWA). Ohio EPA has produced and updated this little known, but important list every two years since 2002. Also known as the Integrated Report it includes important summary statistics such as the number of stream and river miles that meet or do not meet water quality standards for aquatic life and recreation, which are the primary goals of the CWA (i.e., “fishable and swimmable”). Ever since Ohio began tracking trends about the proportion of rivers and streams that meet water quality standards in the late 1980s, a consistent trend of improvement has been documented spanning nearly 30 years (Figure 1). The degree of improvement has been much greater in large rivers compared to small streams (Figure 2) with a net gain of more than 70% of river miles meeting standards since 1980 compared to a net gain of just more than 20% for small stream watersheds. This is due largely to the success of reducing pollution from municipal sewage treatment plants via the “NPDES” (National Pollution Discharge Elimination System) permitting program and that many of the largest facilities are located on large rivers. The comparatively lesser proportion of smaller streams meeting standards is due to the greater influence of “nonpoint sources” of pollution consisting of runoff from land surfaces and stream habitat alteration, neither of which is subject to a comparable permitting program. Instead, nonpoint sources are managed by incentive based or voluntary programs, most of which have shown varying degrees of success in actually improving water quality to meet standards.
A Leveling Off of Restoration
What is noteworthy in these trends is that since 2010 there has been a slight, but detectable decline in the proportion of large river miles meeting standards with a net loss of more than 5% since 2010. While this may seem insignificant and within the error of the biennial reporting, a
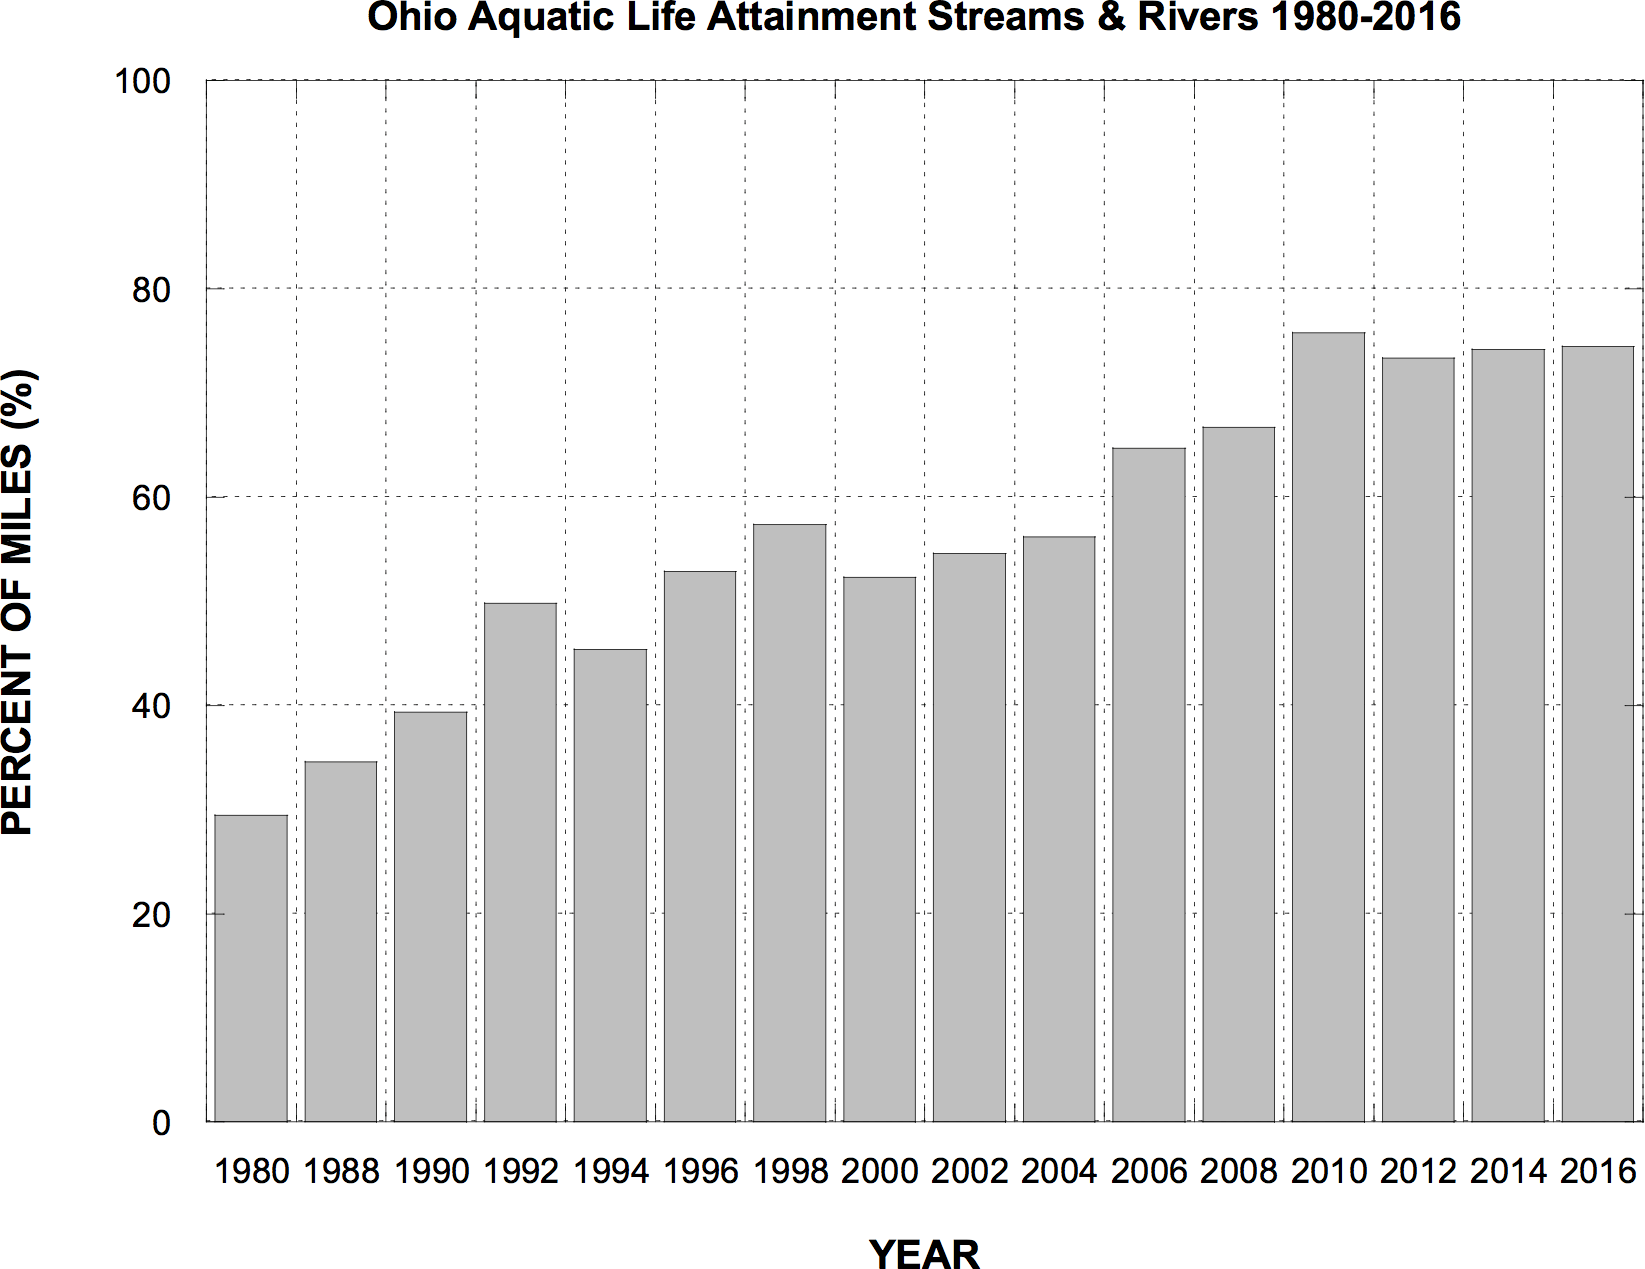
Figure 1. The proportion of stream and river miles meeting Ohio water quality standards for aquatic life in 1980 and biennially from 1988 to 2016 as reported by Ohio EPA in the 2016 Integrated Report.
closer examination of recent Ohio EPA Integrated Reports shows that the declines are indeed real being based on revisits to the same river segments. This leveling off and slowing of the strong trend of improvement observed over 30 years up until 2010 suggests that new sources of pollution have emerged, some previous gains have been lost, and most importantly the gains made possible by the CWA regulatory framework have largely been realized.
As Good As It Gets?
The remaining 40% of the impairments in small stream watersheds are clearly related to nonpoint sources that are subject to a different and perhaps less effective set of management approaches. The net improvements in Ohio rivers and streams over the past 40+ years prompted by CWA mandated controls of water pollution may well be “as good as it gets”. In other words the 90+ percent of large rivers meeting standards in 2010 (Figure 2) could well represent a virtual “complete success” for permitting based restoration and maintaining these gains could be a real challenge in today’s deregulatory climate. Recent initiatives aimed at addressing the remaining impairments in small streams are on the verge of outright elimination which sets the stage for a leveling off or even a reversal of 40+ years of improvement.
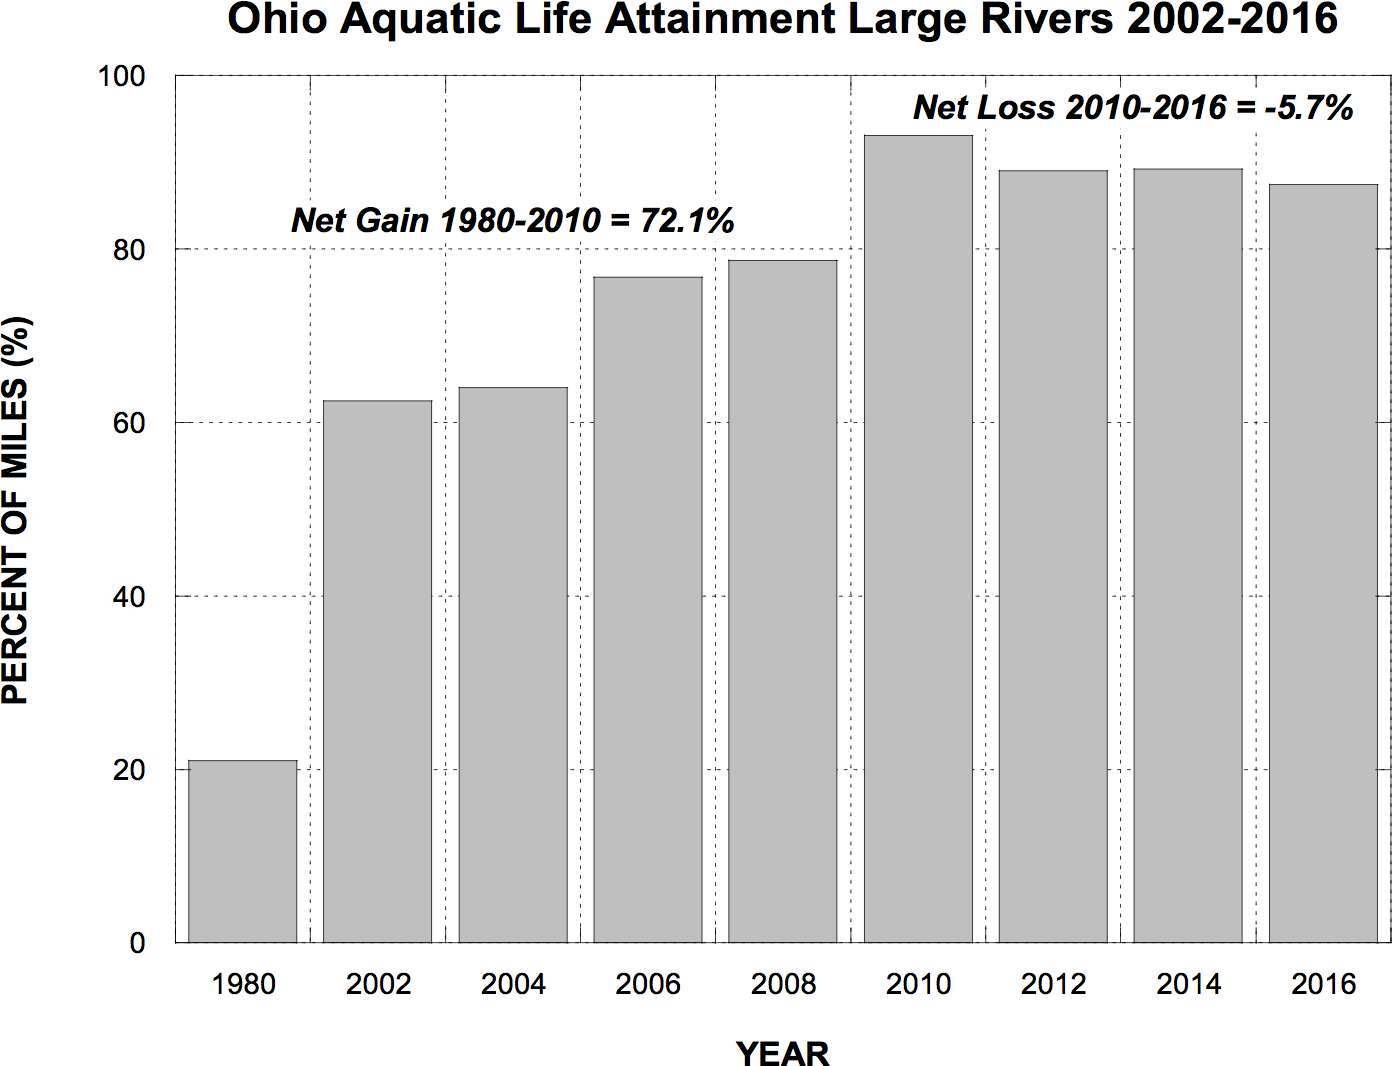
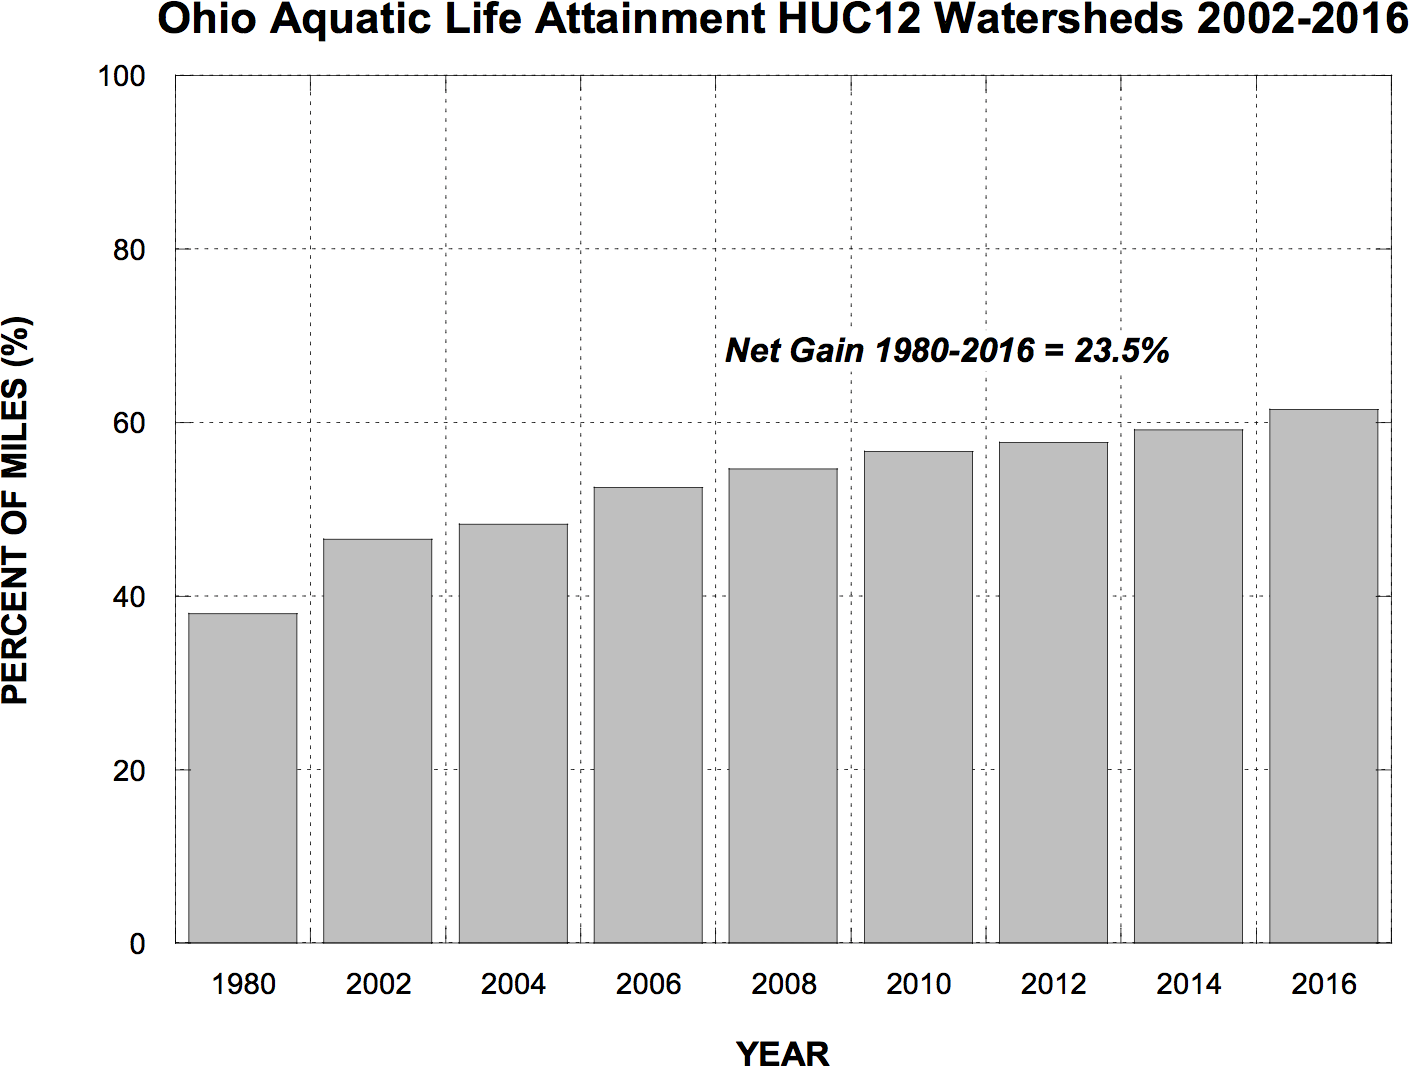
Figure 2. The proportion of large river miles meeting Ohio water quality standards for aquatic life as reported by Ohio EPA in the 2016 Integrated Report showing gains since 1980 and declines since 2010 (upper). The same is shown for smaller streams (watersheds) over the same time period (lower).
The documented “backsliding” in meeting standards in large rivers since 2010, albeit small compared to the gains made since 1980, could expose the reality that wastewater treatment infrastructure is now nearly 30+ years old and is failing in its original efficiency at least in terms of the ability of NPDES compliance to detect it. Population growth and the centralization of sewage flows to mainstem rivers has increased wastewater flow volumes and along with it loadings of pollutants including nutrients. For example, the Little Miami River, which is one of the numerous river-specific success stories that contributed to the 90+ percent of miles meeting standards in 2010, is now impacted by more than 110 million gallons per day of treated sewage flows which in the aggregate can comprise more than 80 percent of the summer base flow in the lower mainstem. For an Exceptional Warmwater Habitat (EWH) designated and performing river, typical advanced wastewater treatment may simply be insufficient to sustain the expected level of exceptional biological quality without additional controls for both conventional pollutants (BOD, ammonia) and nutrients. Given the current deregulatory approach being taken by U.S. EPA and states the prospects for maintaining gains in these high quality rivers is questionable.
What Are the Current Threats?
Current threats also come in the form of increased watershed urbanization and stormwater flows and the resulting and disproportionate degradation of headwater streams - these impacts are less well-regulated compared to point sources. Other threats include emerging pollutants of concern including pharmaceuticals and new generation pesticides and a general acceptance that past successes will always translate forward. Concerning the latter, we now stand two or three generations beyond that which actually witnessed the heavily polluted condition of Ohio’s rivers and streams prior to the 1972 CWA. I put myself in that category at least only remembering as a child when visiting my Aunt in Lima, Ohio in the 1950s having to bury my face in a pillow when crossing the Ottawa River. While we can only hope that any of the even most aggressive deregulatory efforts of today do not have a return to those conditions as a consequence, a complacency of sorts has emerged with an implied redefinition of the purpose of CWA permitting from the “elimination of pollution” to a “cost-of-doing-business”. Add to that the means by which we can now degrade water quality are more insidious and potentially outside the ability of declining ambient and compliance monitoring efforts to detect means that real declines in water quality could more readily go undetected and “right-under-our-own noses”. This is why heightened vigilance over attempts to “streamline” water quality standards, permitting, TMDLs, and monitoring and assessment need to be scrutinized accordingly and with a healthy dose of skepticism. Some these efforts are already in the pipeline with more to follow. Recent and unheralded changes to Ohio’s water pollution law and regulations have already tipped the error margin away from a presumption of protection by making it more difficult to implement responses to new and emerging threats and in some cases to carry out long standing programs. In some ways the climate in the 1970s to roll out increased environmental protections is now reversed, which we hope will not be followed by a reversal of the hard won gains in real water quality improvements between 1980 and 2010. Evidence in the leveling off of these improvements observed since 2010 suggests that this may indeed be “as good as it gets”.